Birds-With-Labels Model
The Birds-With-Labels model combines all five zenodo datasets mentioned in the introduction with Bird-Sounds-Global, annotated soundscapes from xeno-canto.
The five datasets bring almost 407 hours of soundscape recordings with 155,584 bounding box labels of 281 bird species. Bird-Sounds-Global adds 111 hours with 62,030 labels of 765 species from many countries.
The model has 633 classes: the 281 regional species, the 351 Bird-Sounds-Global species with at least 10 training labels in at least 3 recordings, and the unknown class ???? for the rest.
Formerly All-In-One
Until 28 October 2026 this model was called All-In-One. Files made before then still carry the old name: rename All-In-One.pt to Birds-With-Labels_fp32.pt and pass --species-mapping Birds-With-Labels. BirdBox no longer accepts the old name.
Bird-Sounds-Global species (November 2026)
Until November 2026 the model knew only the 282 classes of the five datasets. The current model learned 351 more species from Bird-Sounds-Global. It was trained on spectrograms with the rolling 60 s noise floor, BirdBox's default. The scores on this page were measured with the deprecated segment floor, and the rolling floor scores the same (see Floor).
The previous model's classes keep their ids, so the species mapping Birds-With-Labels serves both models.
More on Birds-With-Labels:
- Training: training curves and boxes per species and split.
- Model Types: the export formats and how closely they match the PyTorch model.
Precision, Recall and F1-Score
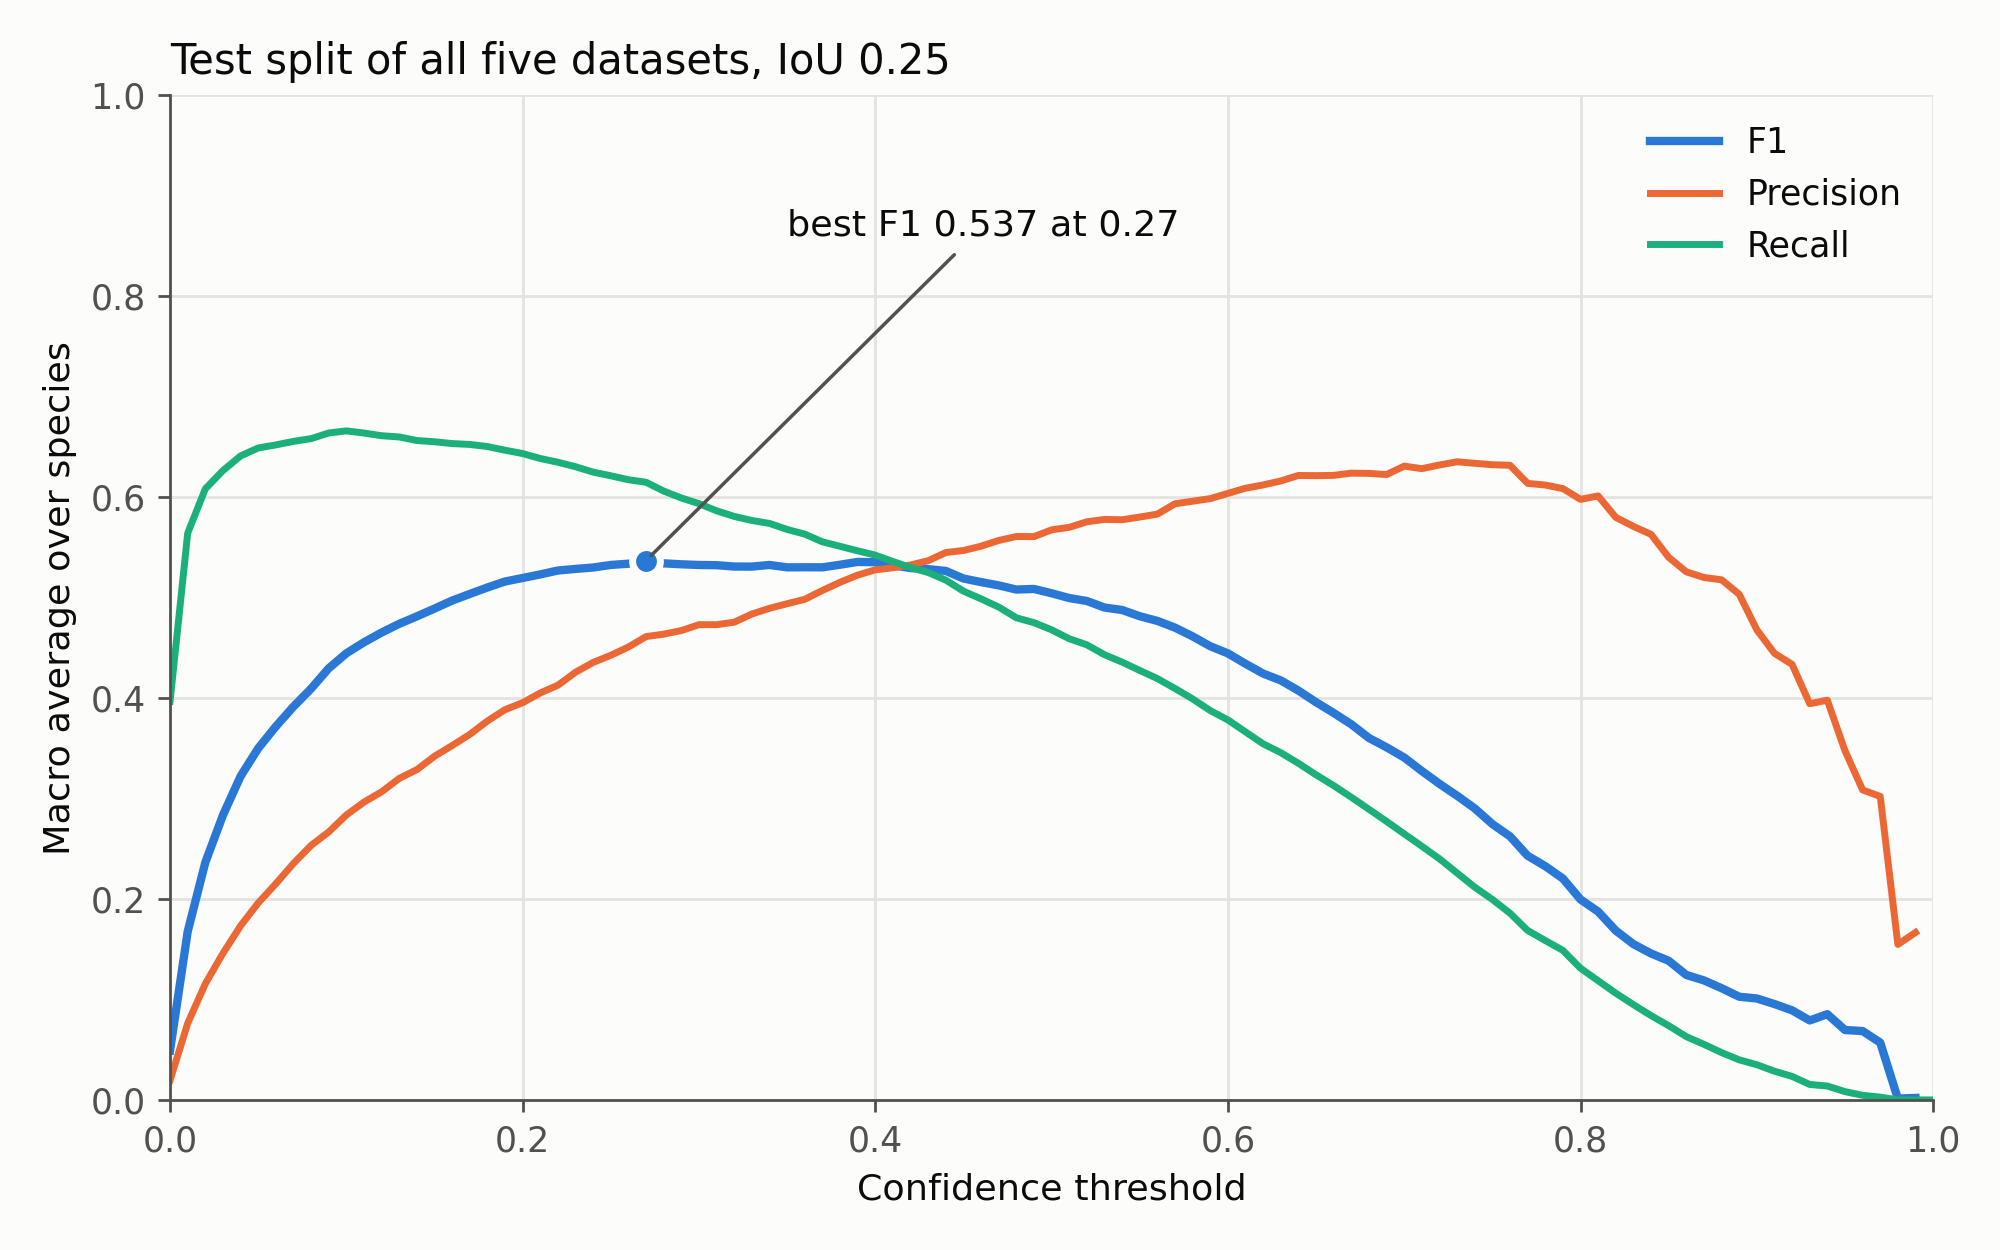
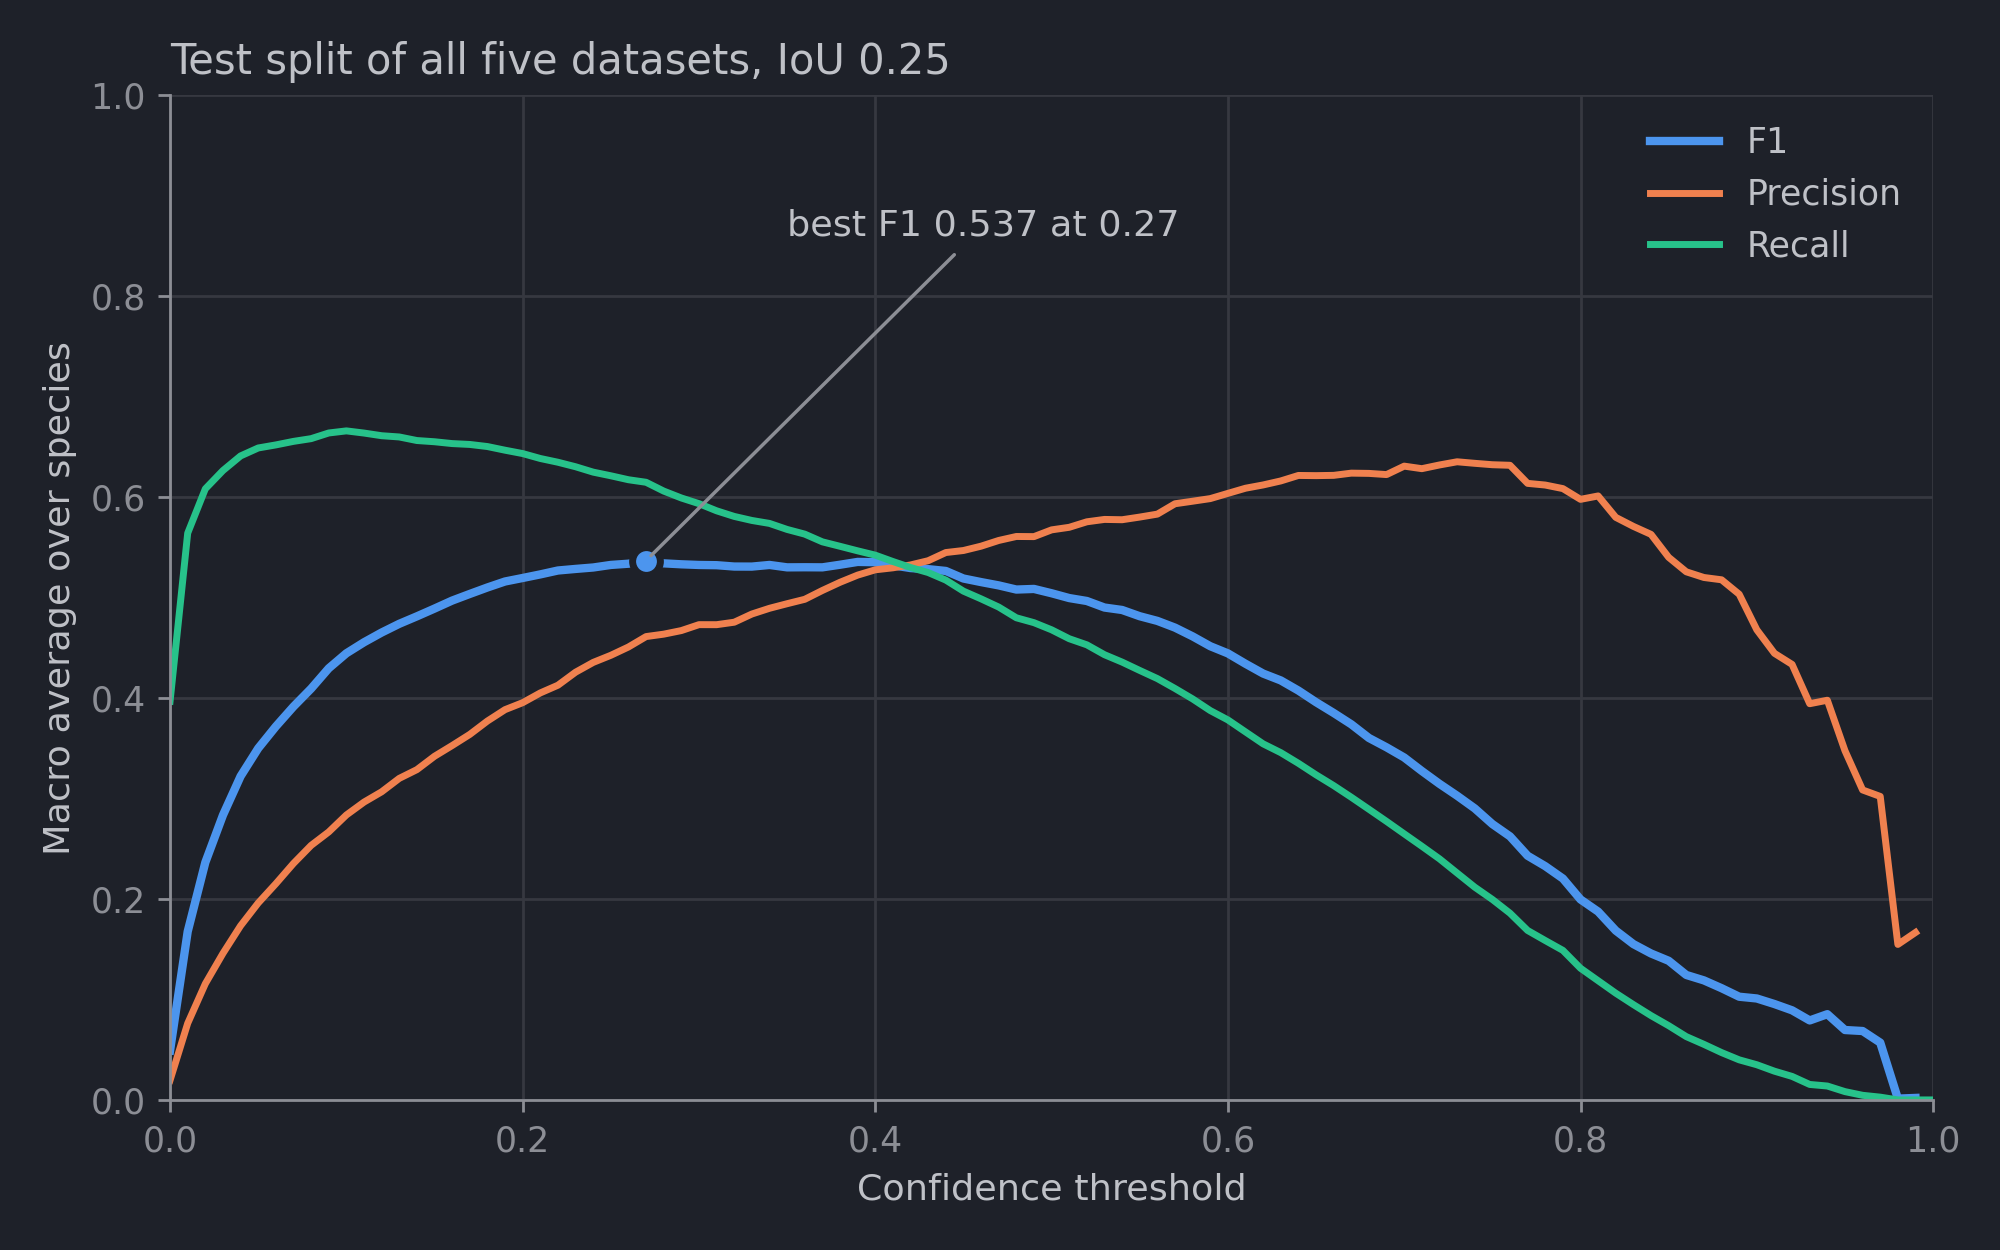
The graph below shows the performance of the model on the test splits under different confidence thresholds: precision, recall and the F1-score, each averaged over the species with test labels (macro average). The upper panel is the test split of the five datasets, the lower one the test split of Bird-Sounds-Global. To optimize the F1-score, pick a confidence threshold around 0.35. The demo starts at 0.25, which keeps more detections at a lower precision.
Average over the labelled species
The F-beta analysis (f_beta_score_analysis.py) also averages over species that have detections but no test labels, each with an F1 of 0 (Overall_Macro). A model with more classes has more of them, so this page averages over the labelled species only: 184 in the regional test split, 357 in Bird-Sounds-Global.
Starting at 0.05
The test detections were made at a confidence of 0.05, so the curves start there.
Compared to the previous model
Both models scored the same way: the segment floor, each test minute and each Bird-Sounds-Global recording on its own, the threshold chosen on the val splits, F1 averaged over the labelled species, IoU 0.25. The last two rows use one threshold for both test splits.
| Test split | Previous model (282 classes) | Current model (633 classes) |
|---|---|---|
| Five datasets, 184 species | 0.540 | 0.523 |
| Bird-Sounds-Global, 357 species | 0.001 | 0.334 |
| Both, 516 species | 0.170 | 0.407 |
| Species with an F1 of at least 0.5 (of 516) | 85 | 187 |
The current model finds 351 more species, but it is slightly worse on the species of the five datasets: 0.018 lower (95% interval 0.002 to 0.030, paired bootstrap over recordings). The difference is largest in the Amazon Basin and on Hawai'i (about 0.03) and small in the three US datasets (0.002 to 0.011). At IoU 0.5 the two models score 0.427 and 0.396.
Floor
The model was trained on spectrograms with the rolling noise floor, BirdBox's default, where each clip's floor comes from the 60 s before its end. The scores above were measured with the segment floor, as BirdBox took it until November 2026. On the regional test split both floors score about the same (macro F1, threshold chosen on val):
| Noise floor | Previous model | Current model |
|---|---|---|
| Rolling, each minute after the minute before it | 0.541 | 0.522 |
| Rolling, each minute alone | 0.534 | 0.517 |
Segment floor, BIRDBOX_FLOOR_WINDOW=segment |
0.540 | 0.523 |
The rolling floor has less audio at the start of a recording, so both models lose a little in the first minute of a file. The gap between the two models stays the same.
Top Performing Species
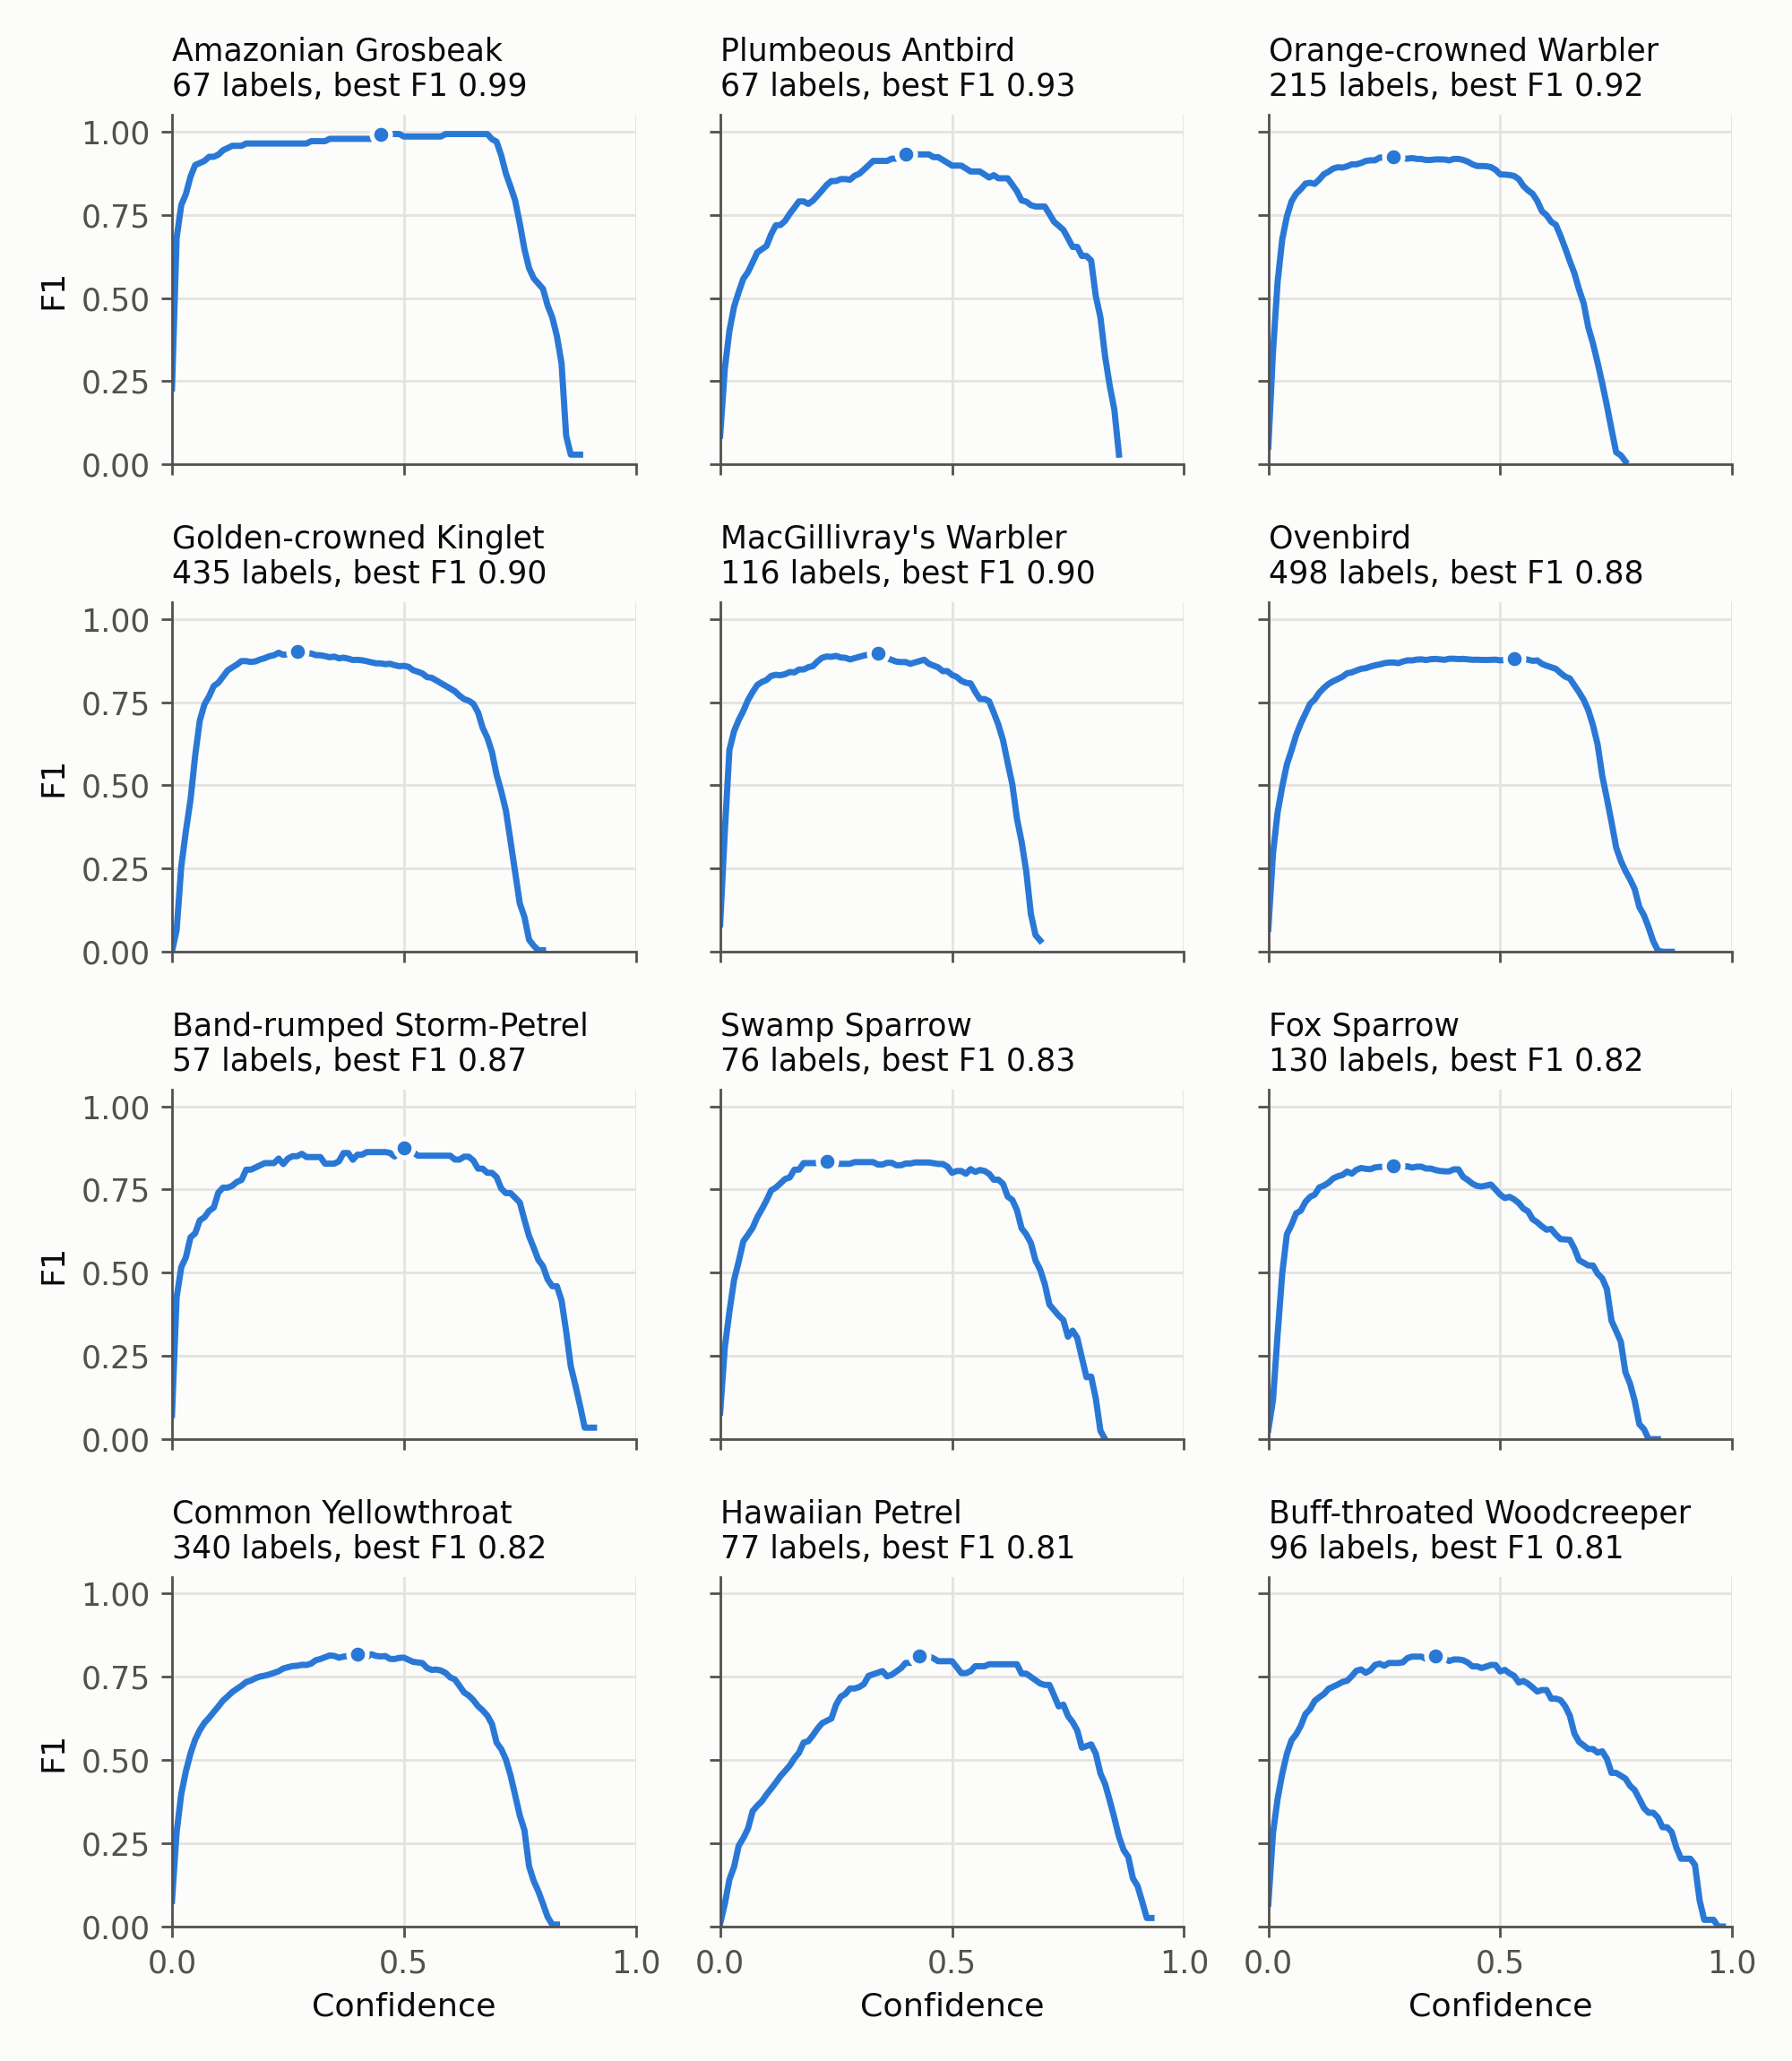
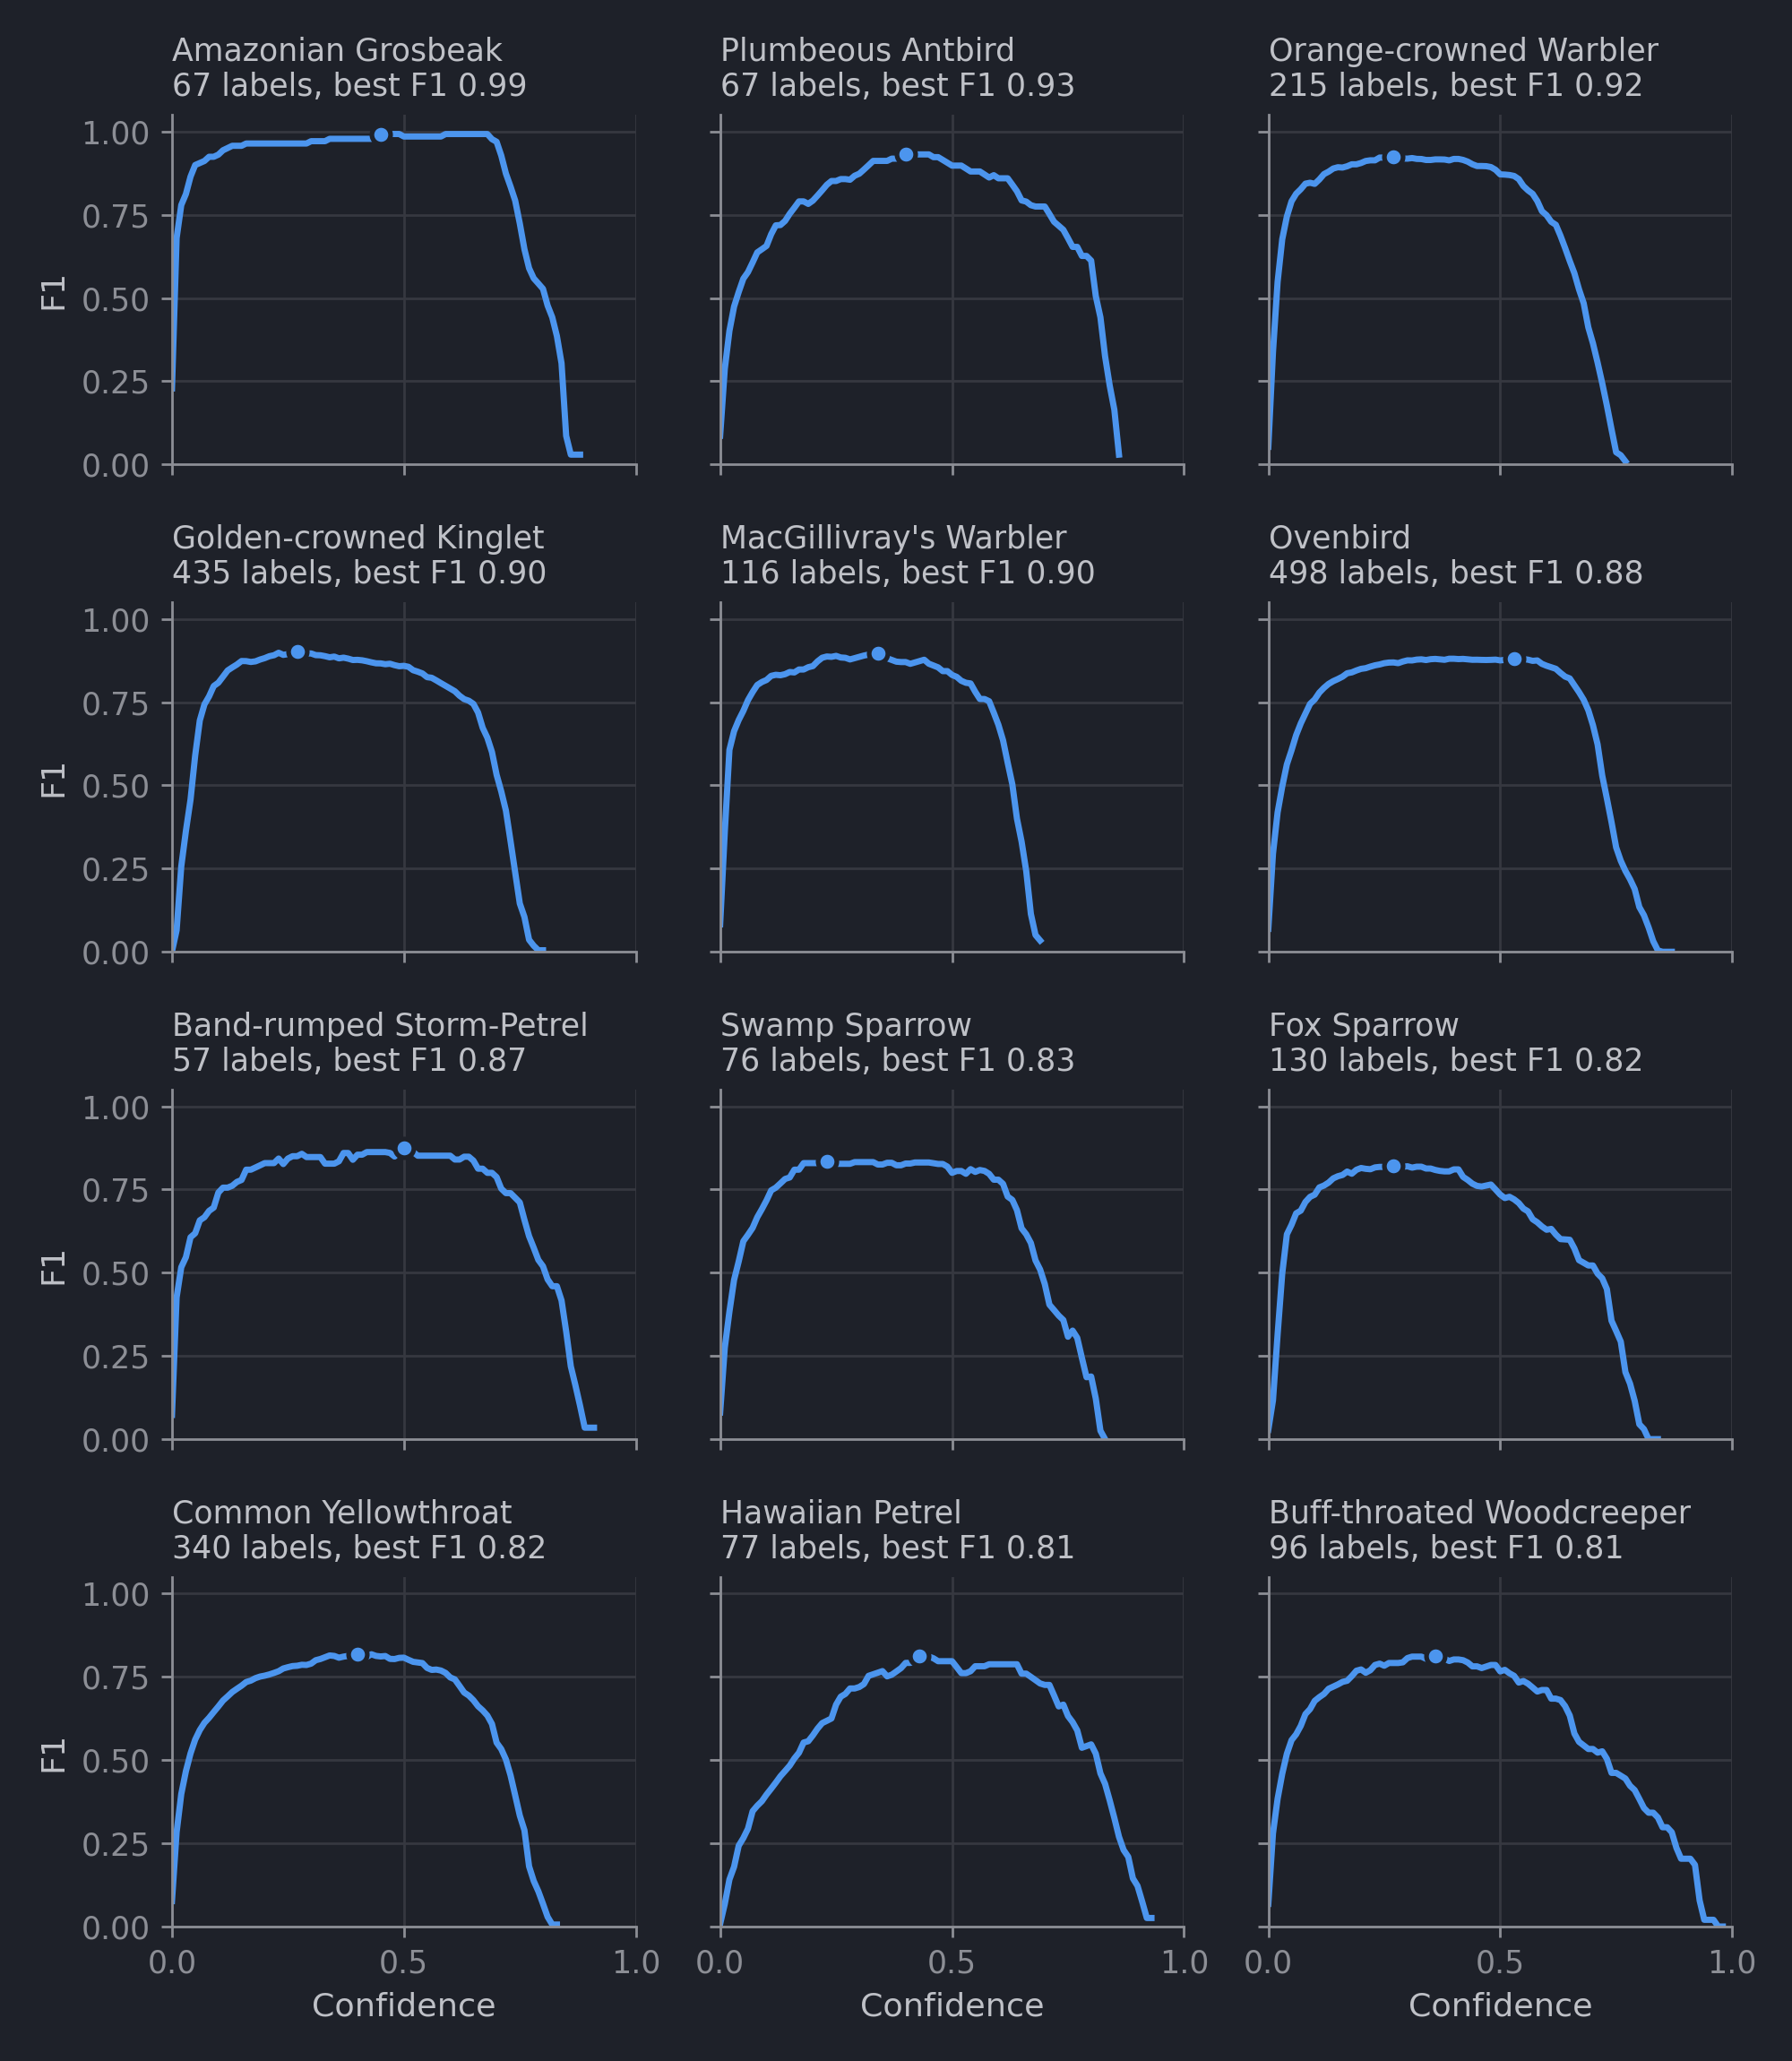
The figure shows the F1-score against the confidence threshold for the 12 best species among the 82 with at least 50 labels in the regional test split. Species with fewer labels are left out: with only a few labels, a high F1 is mostly chance. One species reaches an F1 of 1.0, the House Wren on 13 test labels. At a confidence threshold of 0.35, 11 of the 12 species reach an F1 of at least 0.78. The Scarlet Tanager reaches 0.63 there and 0.81 at 0.64.